I'm building Caffeine, a compiler written in Gleam that compiles service expectations to reliability artifacts. This post documents the motivation and inspiration behind Caffeine, tracing a path from Terraform automation to typed functional compilation.
Frontloading the Buzzwords
SRE - Site Reliability Engineering
As initially designed, Caffeine is a tool that's most interesting to folks within the Site Reliability Engineering (or SRE) community. While I do currently don the title of SRE, I've only done so officially since May 2024 (see my LinkedIn). Yet, I've been unofficially filling this role for years.
Some proof from the web:
2018 @ Stellar Development Foundation - A summer fuzz-testing internship (no blog post 😢)
2021 @ DocuSign - My experience: Why defensive coding matters
2022 @ Spring Health - The Birth of the Performance Lab at Spring Health
My official transition is documented in my 2025 EMEA SRECon talk: Run, Walk, Crawl, or How We Failed Our Way to SLO Readiness.
IAC - Infrastructure as Code
As I mention in that talk, immediately upon moving to the SRE team, I was thrown into a large cloud infrastructure migration project. A significant part of this work was developing Terraform modules for our new infrastructure. Over my first six months working with Terraform, I began to drink the infrastructure-as-code (IAC) Koolaid.
ODD - Observability Driven Development
Another concept I'd been introduced to at DocuSign was observability driven development (ODD): an emphasis on introducing sufficient telemetry instrumentation to understand how code actually performs.
This really clicked for me at DocuSign when, as a junior engineer, I was tasked with introducing changes to DocuSign's core service discovery service (aptly named Discovery). A mentor challenged me: "what is the minimum change you can push to production to understand the actual behavior of your proposed modifications?" Following this advice, my first few PRs focused strictly on instrumentation. After running it in production for a few days, I gained immense confidence about (a) what the changes would look like and (b) most importantly how to know if something went wrong.
It's no exaggeration to say this was a serious "AHA!" 🧠 moment in my engineering career.
Datadog + Terraform = 🔥 but also 😅
At Spring, we use Datadog for observability. It's great. Upon diving into my ODD mentality, I quickly became not only a Datadog power user but unofficially garnered the nickname "Datadog Rob" for my telemetry obsession and willingness to help others "see the light".
Yet while Datadog is an instrumental part of our observability stack, it's got its own quirks, complexities, and downsides. In my opinion, one con is its intimidating interface: it gives you a lot of ways to view your system's telemetry which is powerful, but also hinders adoption for casual users.
Focusing just on monitoring, I discovered teammates had begun exploring Datadog's Terraform provider to IAC their monitors 👀. This was by no means easy... requiring multiple verbose files to define even a single monitor:
Note: Examples below use generic placeholders; any names resembling internal systems are illustrative only.
providers.tf
terraform {
  required_providers {
    datadog = {
      source = "DataDog/datadog"
    }
  }
}
main.tf
resource "datadog_monitor_json" "foobar_example_latency" {
  for_each = {
    for index, monitor in var.latency_change_monitors :
    monitor.resource_name => monitor
  }
  monitor = templatefile("${path.module}/${var.monitor_env}/monitors/templated/change-latency-template.tpl",
    {
      app_name          = coalesce(each.value.app_name, var.app_name),
      team_name         = coalesce(each.value.team_name, var.team_name),
      prod_service_name = coalesce(each.value.prod_service_name, var.prod_service_name),
      resource_name     = each.value.resource_name,
      alert_threshold   = each.value.alert_threshold,
      tags              = concat(local.base_change_latency_tags, each.value.tags)
  })
}
terraform.tfvars
latency_threshold_monitors = [
  {
    resource_name       = "some_resource_thing"
    alert_threshold     = 2.5
    require_full_window = true
    window_minutes      = 10
    tags                = []
  },
  ...
]
variables.tf
variable "monitor_env" {
  type    = string
  default = "production"
}
...
And all of this on top of a template... which is assuming in my process of recollecting the origins of Caffeine here I didn't forget any steps. Surprisingly, IAC-ing monitors was already a big step forward in making Datadog easier to use (and having done some research into the APM tooling space, this has become a baseline feature for basically every vendor across a whole host of telemetry resources from monitors to alerts to dashboards).
Believe it or not, this wasn't quite a pit of success. I know, surprising. Again, I promise it was actually a significant improvement over our current way of operating, but there was still a lot to be desired.
In pursuing improvements, the most obvious route was to see how much of the boilerplate could be generated. While LLMs could probably do a pretty decent job of automating net new monitor Terraform generation by leveraging documentation, user guidance, and a well structured repo, programmatic generation of code is actually a well studied problem... compilers anyone? Ok, I didn't quite go full compiler (not yet 😈). I did however begin writing Ruby to automatically generate Terraform, reducing the number of files users had to create/modify from ~5 to 2.
Creating a new monitor was now reduced to a template file like this:
{
	"name": "[${name}] {{workload.name}} has scaled considerably and is near max replicas!",
	"type": "query alert",
	"query": "some query",
	"message": "some message",
    "tags": ${jsonencode(tags)},
	"options": {
		"thresholds": {
			"critical": ${alert_threshold}
		},
		"notify_audit": false,
		"on_missing_data": "show_and_notify_no_data",
		"include_tags": true,
		"evaluation_delay": 900,
		"new_group_delay": 60
	},
	"priority": 3
}
And a variables file like this:
{
    "monitors" : [
        {
            "name" : "Development",
            "filter_expression" : "<your_filter_expression>",
            "alert_threshold" : 0,
            "window_minutes" : "10",
            "slack_channel" : "<alert_channel>"
        },

        ...

    ]
}
Here some of the benefits of tooling on top of IAC started to really surface:
1. Large-scale metadata changes were no longer ~15 clicks in an intimidating UI, but simple changes across 15 lines of code
2. "Why did someone make this monitor and why" became a question we could actually answer
3. Enforcing best practices became doable since we controlled the transformation layer
A marked improvement over our initial raw Terraform setup. Yet could we go further?

ez-mon: Partial Monitor Template Generation Automation
While monitors could now be modified without navigating to Datadog's UI, creation still required a cumbersome process:
1. Navigate to Datadog's monitor feature
2. Create a monitor that seems reasonable
3. Export the monitor's template
4. Decide what should be a template variable, editing the template to accept these
Assuming the average person had the time, energy, and motivation to do this and would get it right on the first try was unrealistic. Thus git init and the next iteration began: ez-mon.
I leveraged a lot of the same code but expanded the autogeneration capabilities via a CLI tool that also leveraged directory structure to signify (a) team ownership and (b) relevant service. The documentation for the CLI was as follows:
### Generate ###

Command: generate
Description: Net new alert creation. Creates the alert in-repo; it isn't applied (created in Datadog) until configured and `make apply` is run.

Example:
./bin/ez-mon generate \
    --service <service_name> \
    --pod <pod_or_tier> \
    --resource <resource_name> \
    --descriptor <descriptor_or_env> \
    --runbook_link <runbook_url> \
    --priority 2

### Delete ###

Command: delete
Description: Deletes the alert from the repo, local state, and Datadog.

Example:
./bin/ez-mon delete \
    --service <service_name> \
    --pod <pod_or_tier> \
    --resource <resource_name> \
    --descriptor <descriptor_or_env>

### Edit ###

Command: modify
Description: Opens an editor with the configuration of an existing monitor.

Example:
./bin/ez-mon modify \
    --service <service_name> \
    --pod <pod_or_tier> \
    --resource <resource_name> \
    --descriptor <descriptor_or_env>
Unfortunately, creating a tool for monitor generation was challenging as the breadth of queries was too large to realistically pre-populate templates for. Cutting Datadog completely out of the picture proved impossible. Even with all the wins, folks being intimidated by Datadog still loomed.
The tool described above, ez-mon, more-or-less ran its course. The template approach was simple enough for motivated engineers, but if you basically have to create the monitor in Datadog anyway, why not just click the create button there?
ez-slo: A More Scoped Domain Appears
Eventually I found myself leading the effort to adopt SLOs (service level objectives).
The TLDR: an SLO is an opinion over an SLI (service level indicator), which is a metric that emulates a user experience. Thus SLOs are basically a way to quantify how reliable a service is from the user's perspective. Datadog has an SLO feature and Terraform resources for these.
And thus we now had a very interesting opportunity to see how we might leverage our learnings from ez-mon to create a net new tool: ez-slo. What makes SLOs different from monitors is that fundamentally (a) a team responsible for operating a production service likely has far fewer SLOs than monitors and (b) most SLOs take similar shapes. Thus, the breadth of things that we'd want to enable templated generation of might be within a small enough scope (especially if we employ the Pareto principle) to predefine types and keep a majority of our users from ever having to venture into Datadog's UI.
Note that there are actually a few tools in this space who came to similar conclusions:
OpenSLO: a service level objective (SLO) language that declaratively defines reliability and performance targets using a simple YAML specification
Sloth: stop using complex specs and processes to create Prometheus based SLOs. Fast, easy and reliable Prometheus SLO generator.
Nobl9: a powerful service level management software. Manage SLAs, define and monitor SLOs, track latency, and manage service levels
None of these quite fit the bill for us. OpenSLO is too verbose and lacks the opinionated defaults we want, Sloth focuses specifically on Prometheus, and Nobl9 is itself a SaaS product. However, seeing that others had come to a similar conclusion that SLO support tooling could be improved from click-ops or raw Terraform practices was validating.
Reusing many bits from ez-mon, we ended up with an exceptionally simplified user interface that only required specifying an SLI type and various template variable attributes.
slos:
## Feature View
  - view: "/path/to/feature/"
    slis:
      - type: "LCP_Latency"
        duration_threshold_seconds: 2.5
        target: 99.9
      - type: "FE_Renders"
        target: 99.9
Yes, that's really it! And the best part was under the covers we controlled things like rendering proper tags in Terraform, basic threshold enforcement, and opinionated window duration selection that made all the things I documented but folks commonly missed (or ignored) enforceable (and many times even without them knowing)... a true pit of success.
... and no shade on these devs who don't read my docs, I get RTFM'd by my own team weekly ...
Everything Is a Compiler Problem
While a significant improvement over ez-mon, there were some serious drawbacks to how ez-slo encapsulated the configuration of SLI types in the backend Ruby code:
1. SLI types supported only lived in code (even with better docs, still pretty obscure).
2. Inconsistent required attributes make for a wonky interface.
3. Multi-level required attributes (one at SLO level and one per SLI level) was confusing.
4. Extensions required writing Ruby. While we are a Ruby shop, I wanted PMs (product manager) and EMs (engineering manager) alike to be able to use this tool.
I wrote an RFC to formally define how to address these shortcomings.
Overview section from that doc: "Fundamentally, ez-slo was a pipeline for the generation of reliability artifacts from SLO specifications. It differs from OpenSLO in that we seek a higher level of abstraction by default, lowering the barrier for entry and simultaneously improving consumability of configuration specifications through opinionated defaults following in the steps of the Rails Doctrine's convention over configuration. As originally written, the yaml specifications accomplished our goal, being a simple specification that autogenerates Datadog SLOs and a dashboard encompassing all these artifacts. We do NOT seek to propose breaking changes to this format. Instead we seek to redesign the internals in order to promote a more extensible and flexible architecture to support greater org wide adoption. Specifically, we aim to accomplish: clearer separation and isolation of compilation phases, type adoption from the ground up, move slo type, service, and team configuration to the frontend for better visibility and end-user malleability. Fundamentally we're writing a compiler here and we need to better structure this as such."
From the beginning it was always clear that what I was building was a compiler. Zooming out, we had the right structure:
1. frontend: .yaml configuration files
2. middle-end: manipulate user input, enforcing best practices and performing validations
3. backend: generate Terraform
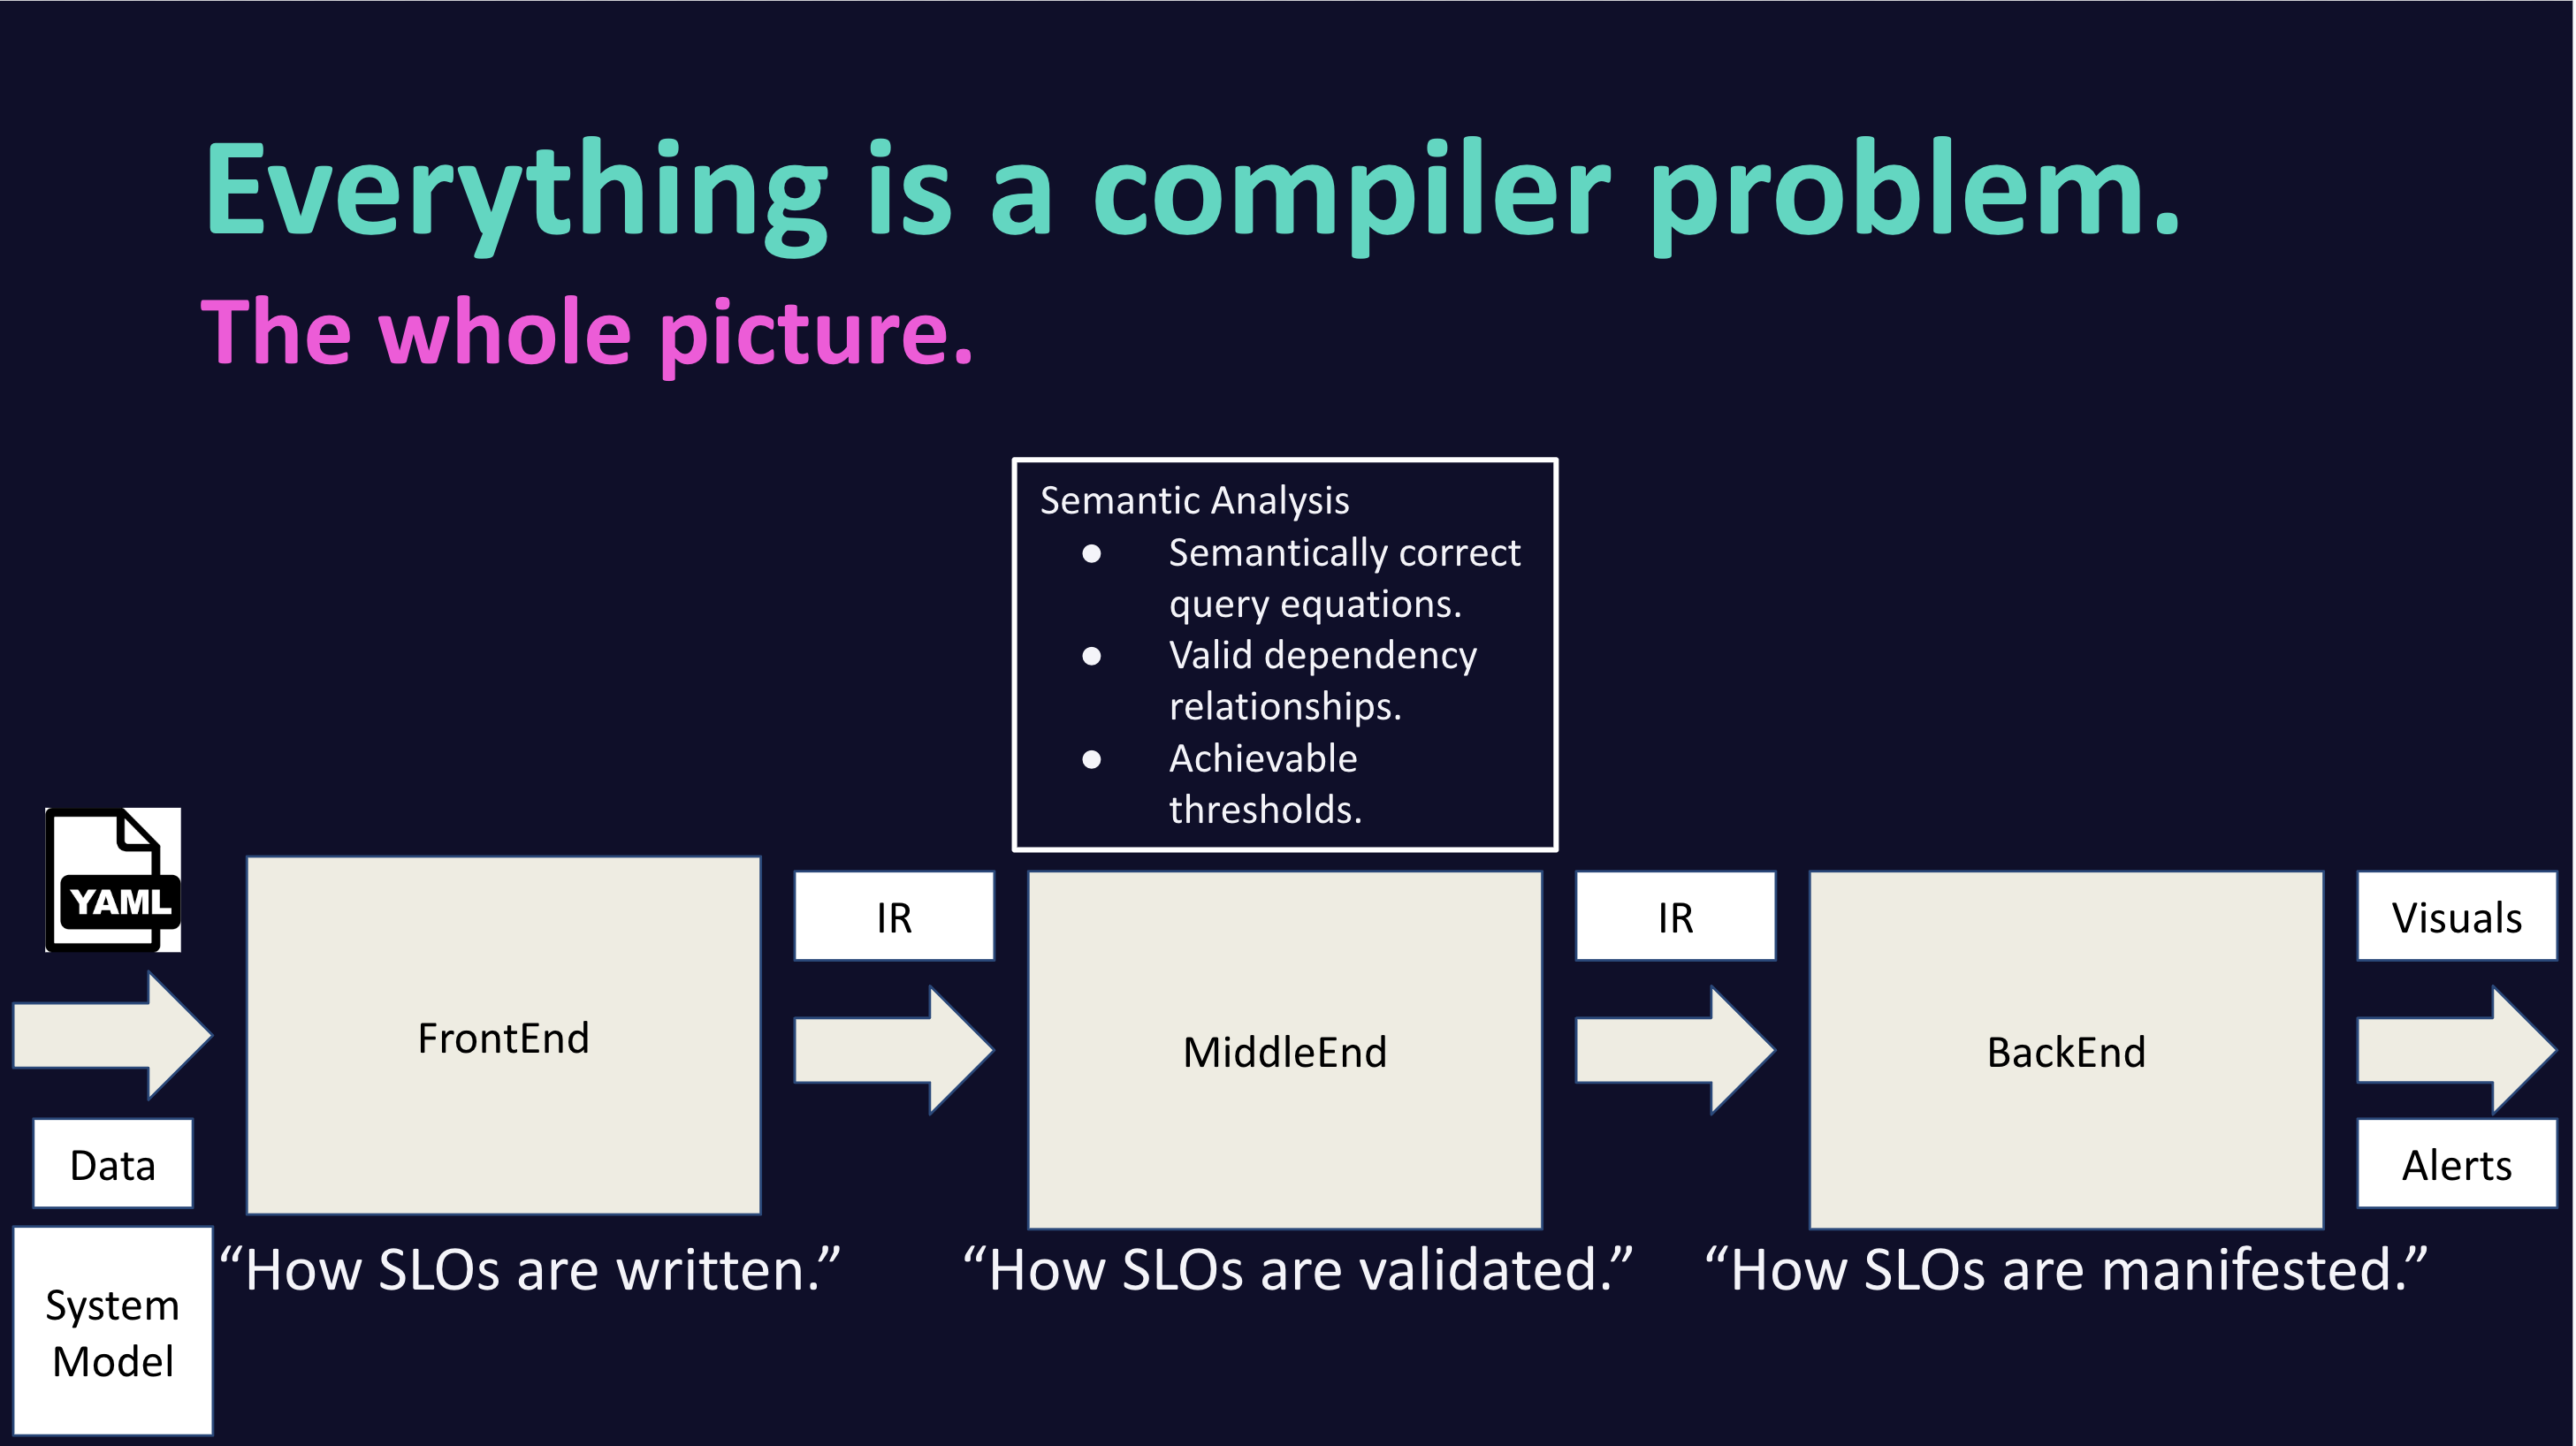
Visual of these ideas as presented at my 2025 EMEA SRECon Lightning Talk
Yet in developing ez-slo, I never really leaned into this until it was too late (it's embarrassing to admit, but I vibe coded myself into a corner).
When trying to extend ez-slo to implement the RFC, it became clear I needed to leverage a more formal compiler design. This was not my first foray into this world. While by no means anything more than a self-proclaimed programming language enthusiast, I do have some experience:
Built my own programming language for an independent study in college
Performed research on inference of asynchronous JavaScript function signatures in collaboration with Northeastern's Programming Language Research Lab
Briefly did some research on designing a type for Pyret with Ben Greenman
So I very excitedly decided it was time to build a compiler properly (and for something I'd actually use at work)!
⭐️ Enter Gleam ⭐️
For starters, I decided it'd be nice to have types. Since Spring is a Ruby shop and at project onset I was developing something that would be maintained internally, this meant exploring sorbet. My first thought was to retrofit types onto my existing implementation, going full gradual typing on ez-slo. I got to a state of a "fully typed" ez-slo, however I came to quickly realize I wasn't actually much a fan of Sorbet. Even Jake Zimmerman, a core contributor to Sorbet, admits Sorbet syntax isn't the prettiest.
From there I tried typed Racket, which I wanted to like, but got annoyed early on by the lack of tooling and library support. Haskell and OCaml were next on the list and I may have gone down those routes if not for the Type Theory for All podcast.
My wife and I were embarking on a long road trip to Jasper, Canada and with many hours to drive ahead (and hours of running to train for my first trail run), I downloaded episodes of this podcast.
During a run at the Seminoe State Park...

Taken at night - not quitting my day job anytime soon to be a photographer
I was listening to an episode titled Self-Education in PL. During this episode, Ryan Brewer spoke very highly about a relatively new programming language called Gleam that seemed to fit exactly what I was looking for: a language that is typed and functional, but friendly and less formal (less scary) than Haskell and OCaml.
Taking a quick step back: before going down the route of a full compiler, I got sign-off from my manager at Spring to develop this project outside of work as an open source, properly licensed repository that I could then use for my SLO efforts at Spring. With that sign-off, I had free rein to choose whatever language, design, etc. I believed would yield the best working software.
With this all said and done, I began working on what I've come to call Caffeine.
After a run through Gleam's online language tour and with the fantastic "everything!" page open in my browser window, development on a compiler proper began.
Towards Simplicity
Today: so complex not even your neighborhood SRE can understand it
For a high-level explanation of how Caffeine works, there are two parts:
1. specifications: definition of SLI types available to the user
2. instantiations: invocations of service expectations via templated definitions leveraging the SLI types
Admittedly, there were a lot of pieces to get the specifications all set up, but once everything fit together and relevant type and service metadata information was provided to the compiler for a proper middle-end phase, we put together a GitHub Action and began using it at Spring.
It was awesome!
Yet in attempting to explain how it all worked, I found myself faced with the reality that the design was way too complex.

In order to facilitate adoption beyond power users and early adopters, I needed to reduce the specification language's complexity. If we dive into how the specification looked, even a simple example highlights the complexity.
Let's start with a minimal instantiation example:
slos:
  - name: "Some Service Operation"
    sli_type: "success_rate"
    typed_instantiation_of_query_templated_variables:
      "gql_operation": "SomeOperation"
    threshold: 99.0
    window_in_days: 7
This was actually the example from the first version of my website (screenshotted here for what one day will be nostalgic):
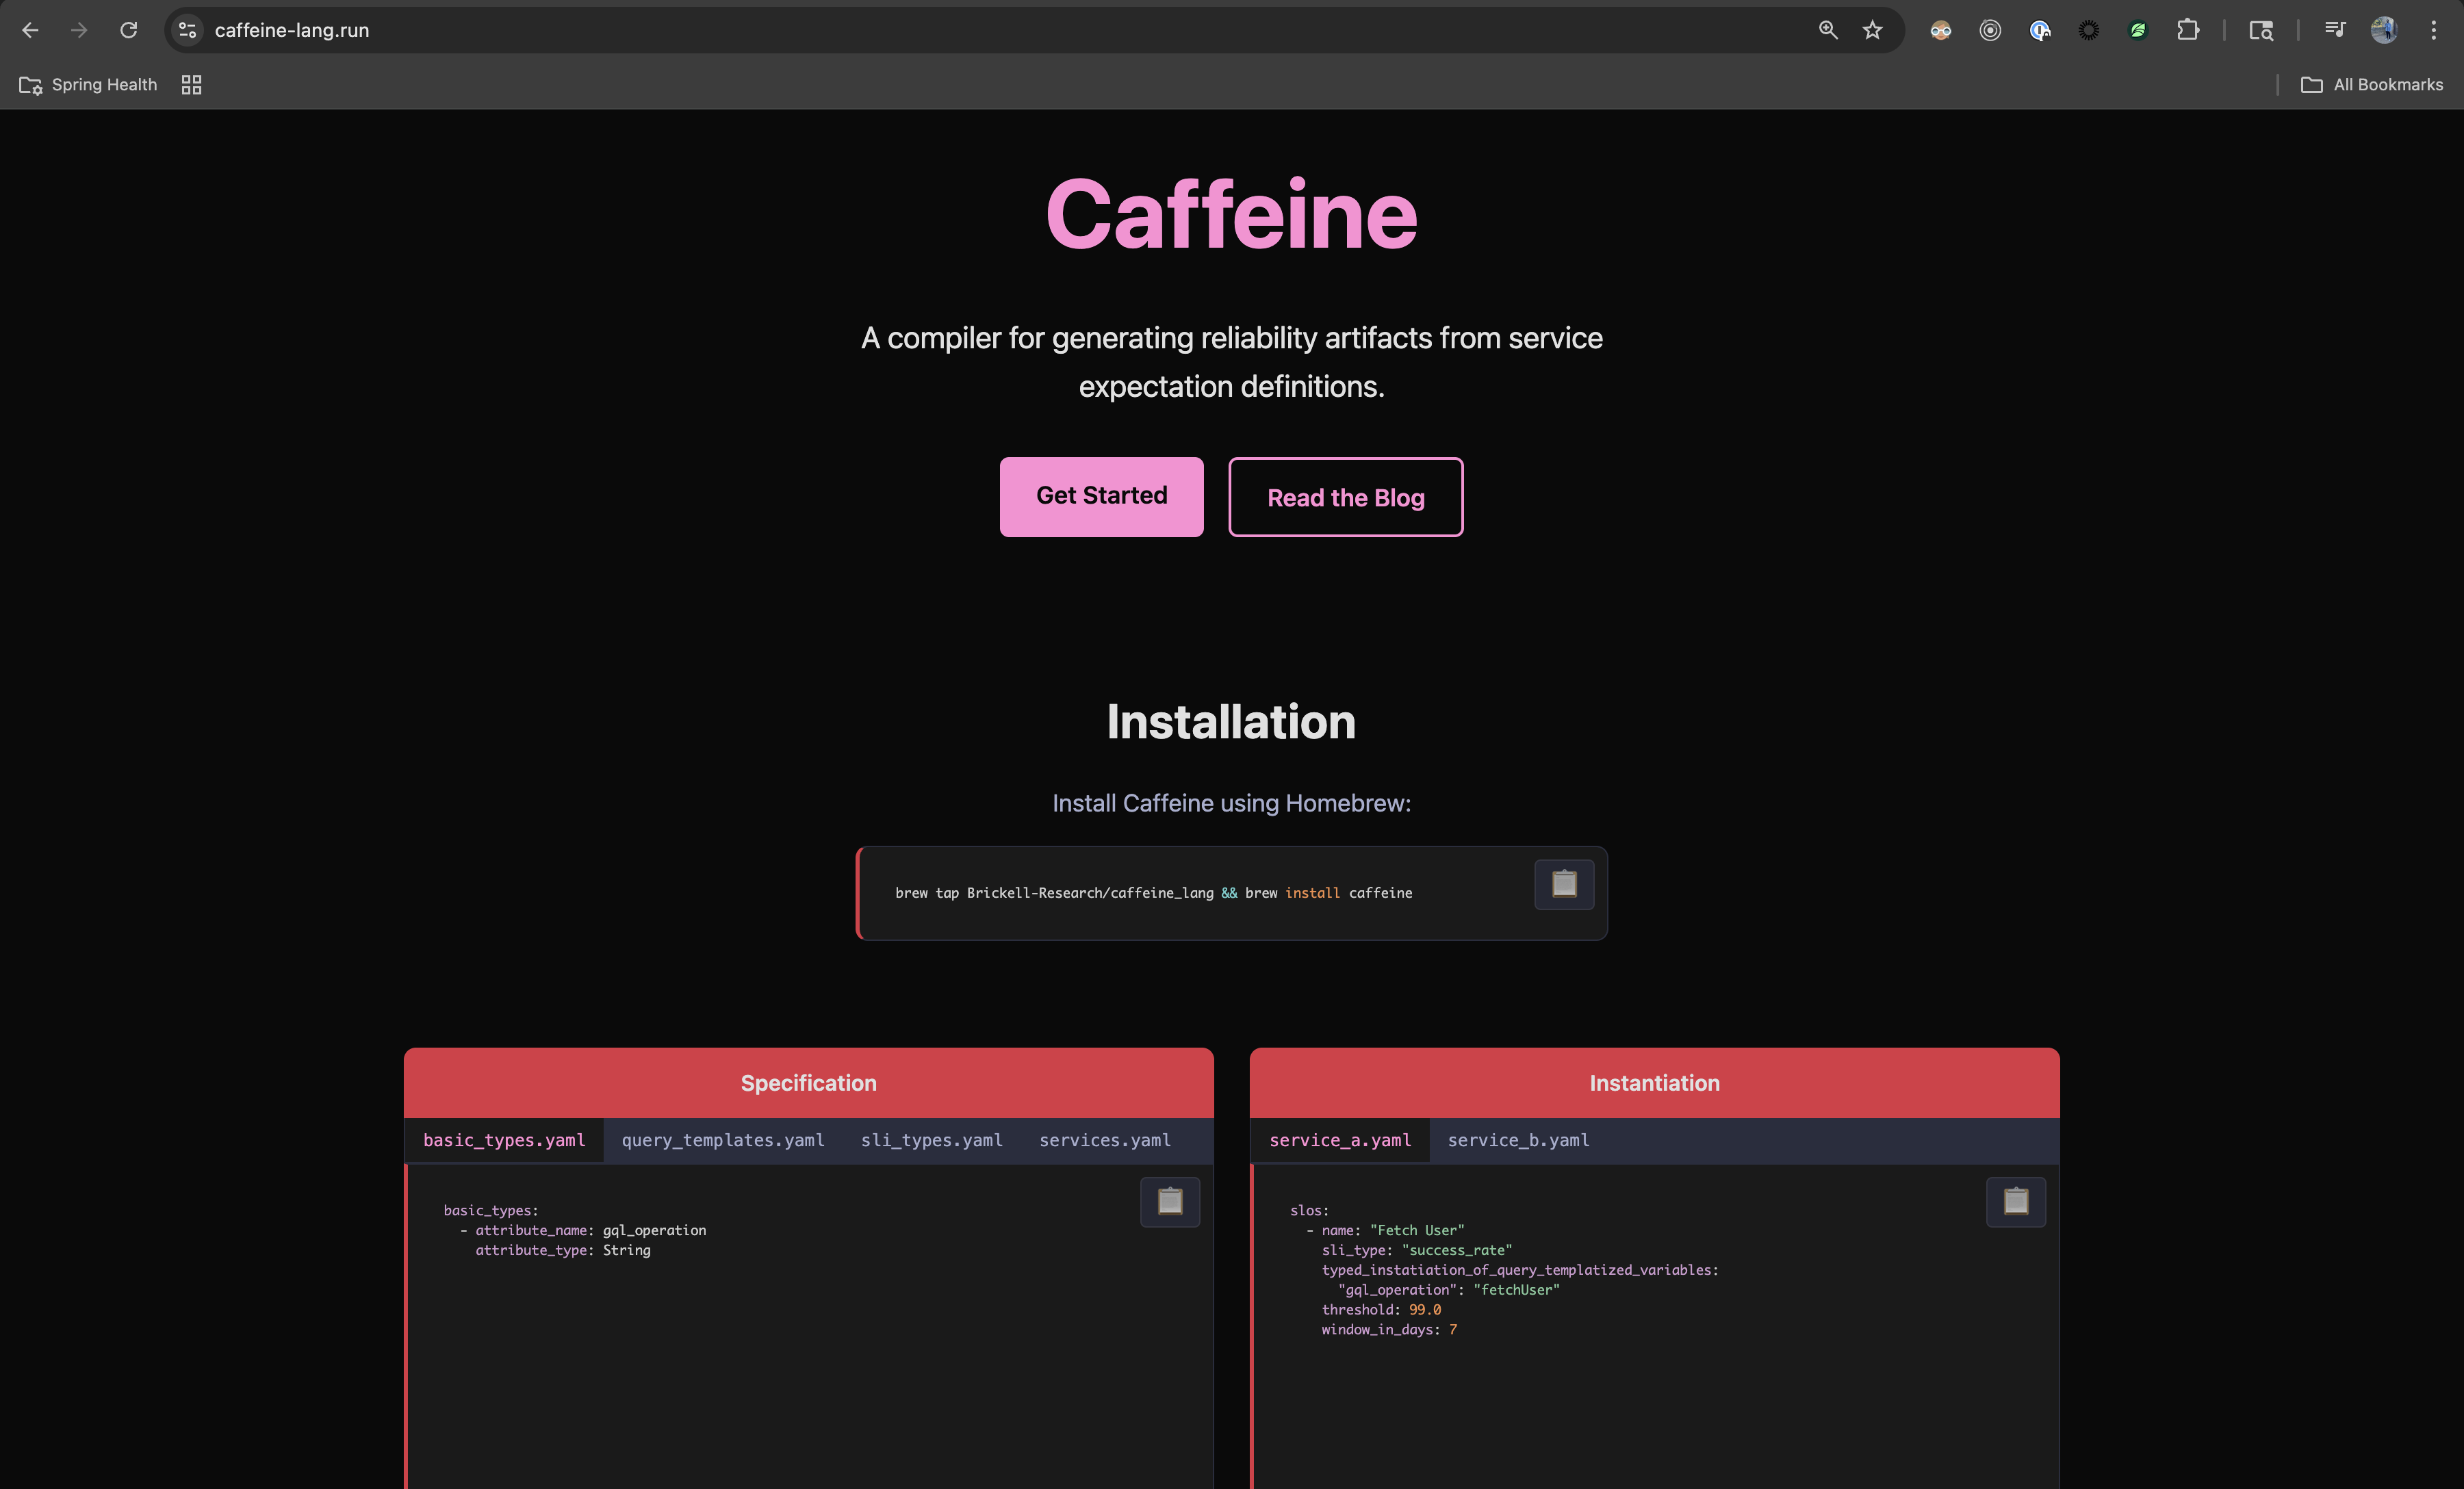
Landing page of caffeine-lang.run circa late November 2025
So here we have a service expectation definition (or an SLO) for a service named "Some Service Operation". The threshold and window here are specific to the SLO and built-in required attributes. sli_type refers to the "success_rate" SLI type and typed_instantiation_of_query_templated_variables is a mapping of expected attribute names to values.
To resolve this, we first ensure this sli_type is supported for this service as per the services specification (services.yaml):
services:
  - name: reliable_service
    sli_types:
      - success_rate
This just ensures the SLIs make sense for a given service, a simple semantic check.
Next we go to the sli_types.yaml to see how success_rate is defined:
types:
  - name: success_rate
    query_template_type: valid_over_total
    typed_instantiation_of_query_templates:
      numerator: "sum.app.requests{$$operation->gql_operation$$, status:info}.as_count()"
      denominator: "sum.app.requests{$$operation->gql_operation$$}.as_count()"
    specification_of_query_templated_variables:
      - gql_operation
Here we have specification_of_query_templated_variables which defines the gql_operation attribute required for this type. As you can see, this is used as a template parameter for the actual queries defined within typed_instantiation_of_query_templates. So, we see what success_rate is, but what is query_template_type and thus what is the significance of valid_over_total? For that we look to the query_templates.yaml specification file:
query_template_types:
  - name: "valid_over_total"
    specification_of_query_templates: ["numerator", "denominator"]
    query: "numerator / denominator"
This basically just says we define the query as a ratio. query here is actually interpreted by a tiny DSL called Caffeine Query Language or CQL (defined here).
And finally, we also provide type annotations to the compiler via the basic_types.yaml specification file:
basic_types:
  - attribute_name: gql_operation
    attribute_type: String
While this all worked and is implemented in Caffeine version v0.1.6, this was one of the simplest possible examples...
Tomorrow: so simple it makes "no code" blush
"so simple it makes "no code" blush" - ok, that's certainly an exaggeration... but it is an inspirational mindset to assume when designing the user interface!
After some time at the whiteboard, I landed on a three-tier architecture with clear separation of concerns:
1. Artifacts: defined by standard library or plugin developers per distinct reliability artifact.
2. Blueprints: defined by observability experts per artifact abstraction referencing artifacts.
3. Expectations: defined by the operating team per service referencing blueprints.
This design cleanly separates responsibilities across an organization - the standard library defines the artifact interface, observability experts create reusable blueprints, and service teams simply declare their expectations.
Here's a simplified example of what this looks like in practice:
artifacts.yaml (defined in stdlib)
artifacts:
  - name: SLO
    passed_down_params:
      - threshold: Decimal
      - window_in_days: Optional(Integer) -> 30
    params:
      - queries: Dict(String, String)
      - value: String
blueprints.yaml (defined by observability experts)
blueprints:
  - name: LCP_Latency
    artifact: SLO
    params:
      - view: String
      - p95_latency_in_seconds: Integer
    inputs:
      - queries:
        - numerator:   ___________________
        - denominator: ___________________
      - value: "numerator / denominator"
expectations.yaml (defined by service owners)
expectations:
  - name: "Admin Portal Home Page LCP Latency"
    blueprint: LCP_Latency
    inputs:
      view: /admin/home
      p95_latency_in_seconds: 5
      threshold: 99.5
With this design, service owners only need to understand their specific inputs - they don't need to know about queries, formulas, or the underlying artifact implementation. The complexity is progressively layered, with each tier adding detail for those who need it.
Conclusion
At the time of writing (November 22, 2025), this post captures the journey to Caffeine and my current progress. We expect things to continue changing as we refine the design and UX.
Caffeine is truly the ultimate result of a combination of my interests, skills, and experience as I pursue the simplest, yet most effective tool to guide production service operators towards a better state of reliability via enhanced ability to reason and assert facts about the system.
And finally, if you made it all the way through this post...